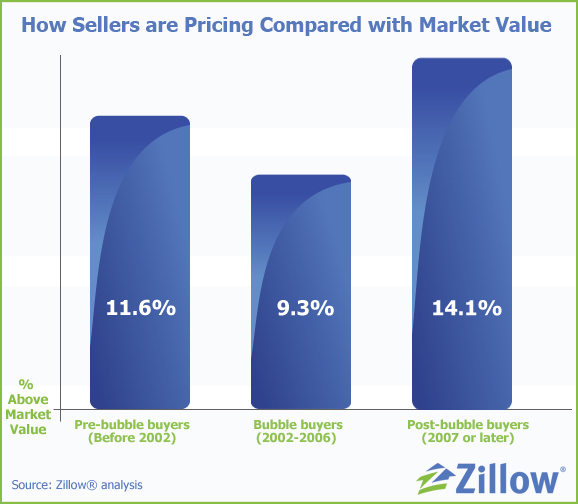
I was reading “Staged-to-Sell, But Is it Priced-to-Sell?” on realtor.com and while the article itself is an interesting read I wanted to get to the bottom of the numbers in the article.
The basic idea is that Zillow measured how home sellers currently priced their home depending on when they originally purchased it.

Human psychology I guess suggests that because they bought after the peak those sellers feel like they bought at a good time. But the collapse took a full five years to play out and thats if we are fully at the bottom.
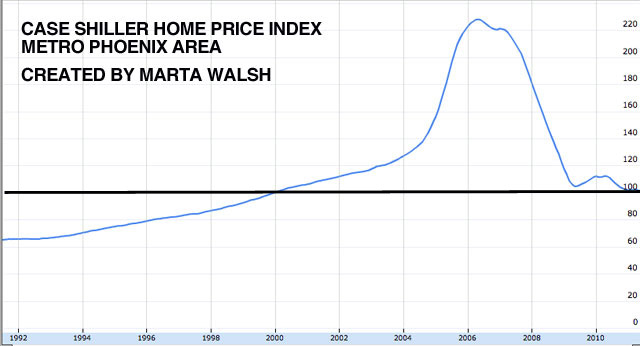
I’ve updated the chart a previously created showing the Phoenix Case Shiller Index.

Now of course not all markets are the same within the Phoenix metro area. Queen Creek house prices very may have not experienced any growth since 2000, but here in some Scottsdale markets thats not the case.
If you are planning to sell a home you can look at the chart and get a rough idea what the market has done since you purchased, but obviously other factors like your micro area, renovations will all become part of the final pricing of your home.
Remember the only way to get a premium price for your home is to have a stunning marketing plan.


